The Caspase family of cysteine proteases has been shown to play a key role in apoptosis. Mammalian caspases can be divided into three functional groups: initiator caspases (Caspase-2, -8, -9, and -10), executioner caspases (Caspase-3, -6, and -7), and inflammatory caspases (Caspase-1, -4, -5, -11, and -12). Caspase-2 belongs to the cysteine protease family, which cleaves proteins specifically after aspartic acid residues. Within this family, Caspase-2 is part of the Ich-1 subfamily and is one of the most evolutionarily conserved caspases across different animal species. It shares similar amino acid sequences with initiator caspases such as Caspase-1, -4, -5, and -9. It is produced as a zymogen containing a long prodomain similar to Caspase-9, including a CARD (Caspase Activation and Recruitment Domain) protein interaction domain. The Caspase-2 precursor (Pro-Caspase-2) consists of two subunits, p19 and p12.
Caspase 2 Activity Assay Kit is based on the hydrolysis of the peptide substrate Ac-VDQQD-pNA (Acetyl-Val-Asp-Gln-Gln-Asp p-nitroaniline) by Caspase-2, producing yellow p-nitroaniline (pNA). pNA exhibits strong absorption at approximately 405 nm, allowing the detection of Caspase-2 activity by measuring absorbance.
Product Component List
C1492383
| Component
| 20T | 50T
| 100T
| Storage
|
C1492383A
| Cell Lysis Buffer
| 5 mL | 10 mL
| 20 mL
| 2-8℃
|
C1492383B
| Reaction Buffer (2×)
| 10 mL
| 20 mL
| 40 mL
| 2-8℃
|
C1492383C
| Ac-VDQQD-pNA (4 mM)
| 100 μL
| 250 μL
| 500 μL
| -20℃. Store in the dark.
|
C1492383D
| pNA (10 mM)
| 100 μL
| 250 μL
| 500 μL
| -20℃. Store in the dark.
|
C1492383E
| DTT (100×)
| 150 μL
| 400 μL
| 750 μL
| -20℃ |
Materials Required But Not Supplied
Microplate reader (capable of measuring absorbance at 405 nm)
96-well plate
Refrigerated centrifuge, ice maker
Adjustable pipettes and tips
Deionized water, phosphate-buffered saline (PBS)
Homogenizer (for tissue samples)
Reagent Preparation
Working Cell Lysis Buffer: Add DTT to Cell Lysis Buffer immediately before use (final concentration: 10 µL DTT (100×) per 1 mL Cell Lysis Buffer). Keep on ice; store at 4°C.
Working Reaction Buffer (1×): Dilute Reaction Buffer (2×) with deionized water to 1× concentration. Add DTT (final concentration: 10 µL DTT (100×) per 1 mL 1× Reaction Buffer). Keep on ice; store at 4°C.
Ac-VDQQD-pNA (4 mM): Ready-to-use. Thaw on ice before use; store at –20°C. Aliquot unused portions and avoid repeated freeze-thaw cycles.
pNA (10 mM): Ready-to-use. Thaw on ice before use; store at –20°C protected from light. Aliquot unused portions and avoid repeated freeze-thaw cycles.
DTT (100×): Ready-to-use. Thaw on ice before use; store at –20°C. Aliquot unused portions and avoid repeated freeze-thaw cycles.
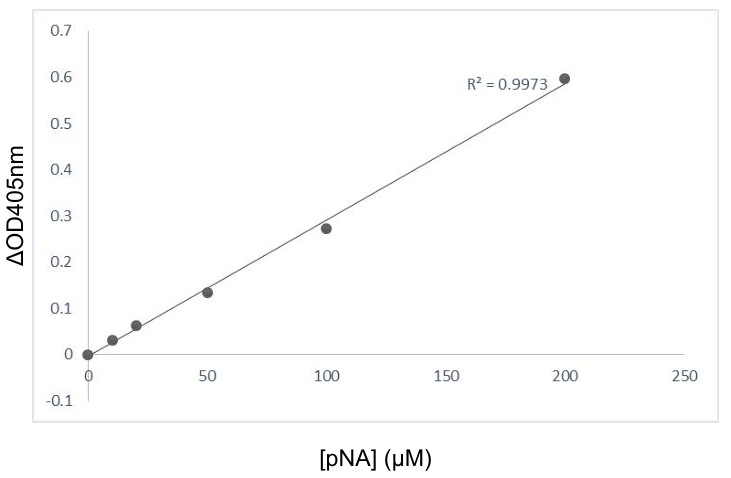
Standard Curve Preparation: Prepare pNA standard solutions at 200, 100, 50, 25, 12.5, and 0 µM using Reaction Buffer (1×, containing DTT) according to the table below. Note: Prepare a fresh standard curve for each experiment. Diluted standards are unstable and must be used within 4 hours.
Standard
| Volume of Standard / Previous Standard
| Volume of Reaction Buffer (1×, with DTT) (µL)
| Concentration (μM)
|
Std.1
| 6 µL pNA (10 mM)
| 294
| 200
|
Std.2
| 150 µL of Std.1 (200 μmol/mL)
| 150 | 100
|
Std.3
| 150 µL of Std.2 (100 μmol/mL)
| 150
| 50 |
Std.4
| 150 µL of Std.3 (50 μmol/mL)
| 150
| 25 |
Std.5
| 150 µL of Std.4 (25 μmol/mL)
| 150
| 12.5 |
Std.6
| 0
| 150
| 0 |
Sample Preparation
Note: Fresh samples are recommended. Alternatively, store samples at -80°C after preparation. Thaw on ice before use, as freeze-thaw may affect stability and yield lower readings. Do not use protease inhibitors during sample preparation, as they may interfere with the assay.
Induce apoptosis in cells by an appropriate method. Include an uninduced control culture for each assay.
For adherent cells: Harvest by trypsinization. Centrifuge at 600 g, 4°C for 5 min. Carefully aspirate supernatant. Wash cell pellet twice with 1 mL PBS. Resuspend 1-5×10⁶ cells in 50 µL Working Cell Lysis Buffer.
For suspension cells: Centrifuge at 600 g, 4°C for 5 min. Carefully aspirate supernatant. Wash cell pellet twice with 1 mL PBS. Resuspend 1-5×10⁶ cells in 50 µL Working Cell Lysis Buffer.
For tissues: Mince 5-20 mg tissue into small pieces. Rinse with PBS. Homogenize in 0.1 mL Working Cell Lysis Buffer on ice.
Incubate lysates on ice for 15-20 min.
Centrifuge at 16,000 g, 4°C for 15 min. Transfer supernatant to a new tube and keep on ice.
Measure Caspase-2 activity immediately or store samples at -80°C. Determine protein concentration using a Bradford assay.
Assay Procedure
Preheat microplate reader for at least 30 min. Set wavelength to 405 nm.
Set up reactions in a 96-well plate as described below.
Volume (μL)
| Blank Well
| Test Well
| Control Well (For Tissue Samples)
| Standard Well
|
Working Reaction Buffer (1×, with DTT)
| 100
| 50
| 55 | 0 |
Standard
| 0 | 0 | 0 | 100 |
Supernatant
| 0 | 50 | 50 | 0 |
Ac-VDQQD-pNA(4 mM)
| 5 | 5 | 0 | 0 |
For Blank, Test, and Control Wells:
Mix thoroughly and incubate at 37°C for 1–2 hours. Measure the absorbance at 405 nm.
Record the absorbance of the Blank Well as Ablank.
Record the absorbance of the Test Well as Atest.
Record the absorbance of the Control Well as Acontrol.
Calculate:
ΔAmeasured = Atest – Ablank
Note:
Control Wells are required only for tissue samples.
For tissue samples, use: ΔAmeasured = Atest – Acontrol
For Standard Wells:
Measure the absorbance at 405 nm immediately after preparation.
Calculate:
ΔAstandard = Astandard – AStd.6
where AStd.6 is the absorbance of Standard Well 6 (0 μM pNA).
Note:
Blank and standard wells need only 1-2 replicates.
For tissue samples with intrinsic color, include a sample background control well (sample + all reagents except substrate). This is generally unnecessary for cell samples.
Mix reactions gently, avoiding bubbles.
Read absorbance at 405 nm when a distinct yellow color develops. If color change is weak, extend incubation time up to 4 hours.
Calculations
Note: Provided formulas include a detailed derivation and a simplified version. They are equivalent. The simplified formula (in bold) is recommended for final calculation.
Standard Curve Method: Plot standard concentration (x-axis) against ΔA₄₀₅ (A₄₀₅ Standard - A₄₀₅ Blank) (y-axis) to obtain the equation y = kx + b. Calculate the concentration (x, in µM) for the sample using its ΔA₄₀₅ (A₄₀₅ Sample Test - A₄₀₅ Blank or Sample Background Control if used).
Percentage Increase in Activity:
Caspase-2 Activity Increase (%) = [(A₄₀₅ Treated Sample - A₄₀₅ Blank) / (A₄₀₅ Untreated Control - A₄₀₅ Blank)] × 100%
This simple method provides a reliable estimate of relative activity changes.
Enzyme Activity Calculation (U/mg prot):
One unit of enzyme activity is defined as the amount of enzyme that cleaves 1.0 nmol of the colorimetric pNA substrate per hour at 37°C under saturated substrate concentrations (per Chemicon's definition).
Caspase-2 Activity (U/mg prot) = 2.1 × x ÷ Cpr ÷ T
x: pNA concentration from standard curve (µM)
Cpr: Sample protein concentration (mg/mL)
T: Reaction time (hours)
2.1: Derived from (V_reaction_total × 10³) ÷ (V_sample) = (0.105 mL × 1000) ÷ (0.05 mL) = 2100, converted to 2.1 for the simplified formula (considering unit conversions for nMol and µM).
Derivation details:
Caspase-2 Activity (U/mg prot) = (x × V_reaction_total) ÷ (V_sample × Cpr) ÷ T × 10³
V_reaction_total: Total reaction volume (0.105 mL = 1.05×10⁻⁴ L)
V_sample: Volume of sample added (0.05 mL)
10³: Conversion factor (1 µmol = 10³ nmol)
Note: For samples with very high Caspase-2 activity, dilute with Working Cell Lysis Buffer before assay and multiply the result by the dilution factor (n).
Result Presentation
Representative Standard Curve: The following data and curve are for reference only. Users must generate their own standard curve for accurate quantification.