Cell Cycle and Apoptosis Analysis Kit - BioReagent, for microscopy, Biological Stain, Suitable for Immunofluorescence(IF), for fluorescence analysis, for cell culture, ready-to-use, for DNA and RNA applications, sterile-filtered, high purity

Cat. No.: P1373478
AVAILABLE TO ORDER
GRADE & PURITY Sterile-filtered ? Sterile-filtered — passed through a 0.2µm filter to remove microorganisms. Use as a ready aseptic solution for culture and sensitive applications. BioReagent ? BioReagent grade — tested suitable for life-science and molecular-biology use. Use for cell culture, assays, and biochemical work needing biological compatibility. Ready-to-use ? Ready-to-use — supplied pre-formulated at working concentration, no prep needed. Use to save time and reduce pipetting/dilution errors. Biological Stain ? Biological stain grade — dyes characterized for staining cells and tissues. Use in histology and microscopy where staining consistency matters. for Fluorescence analysis ? Fluorescence-analysis grade — very low fluorescent impurities for clean spectra. Use in fluorescence assays where background interferes. for Microscopy ? Microscopy grade — reagents/stains suited to sample prep and imaging. Use in microscopy where clarity and low background are needed. for Cell culture ? Cell-culture grade — low endotoxin and contaminants to support viable cell growth. Use in mammalian/other cell culture media and supplements. for DNA and RNA applications ? For nucleic-acid (DNA & RNA) applications — nuclease-controlled across both. Use in workflows handling DNA and RNA together where degradation is a risk. Suitable for Immunofluorescence(IF) ? IF grade — validated for immunofluorescence with low background staining. Use to localize targets in cells/tissue by fluorescence microscopy.
 ·  off list, applied to all prices below.
Size
Status
Price
Qty
20T
P1373478-20T
1-2 wks(?)
Item is derived from our semi-finished stock and is processed in 1-2 weeks.
$29.90
50T
P1373478-50T
1-2 wks(?)
Item is derived from our semi-finished stock and is processed in 1-2 weeks.
$59.90
100T
P1373478-100T
1-2 wks(?)
Item is derived from our semi-finished stock and is processed in 1-2 weeks.
$99.90
Enter a quantity for the sizes you want to add.
🧪

Why this grade

BioReagent, for microscopy, Biological Stain, Suitable for Immunofluorescence(IF), for fluorescence analysis, for cell culture, ready-to-use, for DNA and RNA applications, sterile-filtered Biological Stain,BioReagent,for Cell culture,for DNA and RNA applications,for Fluorescence analysis,for Microscopy,Ready-to-use,Sterile-filtered,Suitable for Immunofluorescence(IF) for sensitive chromatographic and analytical workflows requiring minimal baseline interference.

🌡

Storage & shipping

Protected from light,Store at -20°C,Avoid repeated freezing and thawing Ships Ice chest + Ice pads Check lot-specific COA for exact specifications.

📋

Quality documents

SDS, COA, datasheet, and spec sheet available for download. Lot-specific COA accessible via lot number lookup.

📚

Literature proof

Cited in 1 peer-reviewed publications across chromatography, organic synthesis, and cross-coupling reactions.

Overview

  The Cell Cycle and Apoptosis Kit (Cell Cycle and Apoptosis Kit) is a test kit that uses the classic propidium iodide (PI) staining method to analyze the cell cycle and apoptosis. Propidium iodide is a fluorescent dye for double-stranded DNA. When propidium iodide binds to double-stranded DNA, it can produce fluorescence, and the fluorescence intensity is proportional to the content of double-stranded DNA. After the DNA in the cells is stained with propidium iodide, the DNA content of the cells can be measured using a flow cytometer, and then based on the distribution of DNA content, the cell cycle and apoptosis can be analyzed. After staining with propidium iodide, if the fluorescence intensity of G0/G1 phase cells is 1, then the theoretical fluorescence intensity of G2/M phase cells containing double genomic DNA is 2, and the fluorescence intensity of S phase cells undergoing DNA replication is between 1 and 2. Apoptotic cells, due to the condensation of the cell nucleus and the fragmentation of DNA (DNA fragmentation), cause some genomic DNA fragments to be lost during staining, so the iodine staining of apoptotic cells presents a significantly weak color, that is, the fluorescence intensity is less than 1, and a so-called sub-G1 peak appears on the fluorescence graph of flow cytometry, which is the peak of apoptotic cells. When cells undergo apoptosis, due to the concentration of cytoplasm and chromatin, apoptotic bodies are produced, causing changes in the light scattering properties of the cells. In the early stage of cell apoptosis, the ability of the cell to forward-angle light scattering significantly decreases, while the ability of lateral light scattering increases or remains unchanged. In the late stage of cell apoptosis, the signals of forward and lateral light scattering both decrease, so the changes in cell light scattering can be measured using a flow cytometer to observe the apoptosis situation. This kit is usually applied to the detection of the cell cycle and apoptosis of cultured adherent or suspended cells. If used for the cell cycle and apoptosis detection of cells from tissues, the tissue must be digested into a single-cell state before detection can be performed. 

P1373478

Component

20 T

50 T

100 T

Storage

Quantity Per Test

P1373478A

Dyeing buffer solution

10 mL

25 mL

50 mL

-20℃.

500 μL per  1 × 10⁶ cells.

P1373478B

Propidium Iodide staining solution (20X)

100 μL

250 μL

500 μL

-20℃.Store in the dark.

5 μL per  1 × 10⁶ cells.

P1373478C

RNase A (50X)

0.2 mL

0.5 mL

1 mL

-20℃.

10 μL per  1 × 10⁶ cells.

Note: The recommended number of cells to stain per test is  1 × 10⁶ cells

Instructions for use

1.Collect cells and wash twice with ice-cold PBS; resuspend in ice-cold PBS at a density of 0.1–1.0 × 10⁷ cells/mL.

2.In the cell suspension, anhydrous ethanol was added dropwise while shaking until the final ethanol concentration reached 70%.

3.Mix gently and fix overnight at 4 °C.

4.Wash cells twice with ice-cold PBS, then resuspend in dyeing buffer solution of 2 × 10⁶ cells/mL.

5.Add 5 µL of  Propidium iodide and 10 µL RNase A to 500 µL of the cell suspension.

6.Resuspend cells gently and thoroughly, then incubate at room temperature for 30 min in the dark.

7.Analyze samples by flow cytometry.

Note: Please bring your own PBS and absolute ethanol.

Precautions 

1. Fluorescent dyes all have the problem of quenching. Please try to avoid light during storage and use to slow down fluorescence quenching.  

2. Iodophor is irritating to the human body. Please take appropriate protective measures.  

3. Iodophor is a known mutagen, so this solution needs to be treated with activated carbon before being discarded.  

4. When fixing cells with 70% ethanol, make sure it is thorough; otherwise, uneven staining will result in unclear or inaccurate results. It is recommended to fix the cells overnight at -4℃ with 70% ethanol.  

5. After cell fixation, ensure that the cells are in a single-cell suspension; cell adhesion may affect our results.  

6. For your safety and health, please wear laboratory coats and disposable gloves during operation.  

7. This product is only for scientific research and cannot be used for clinical diagnosis or treatment, nor for food or medicine. It must not be stored in ordinary residences. 


Storage and Shipping
Storage
Protected from light,Store at -20°C,Avoid repeated freezing and thawing
Shipped In
Ice chest + Ice pads
Stability And Storage
Store at -20℃ long term (12 months). Store in the dark. Avoid repeated freezing and thawing.
Images

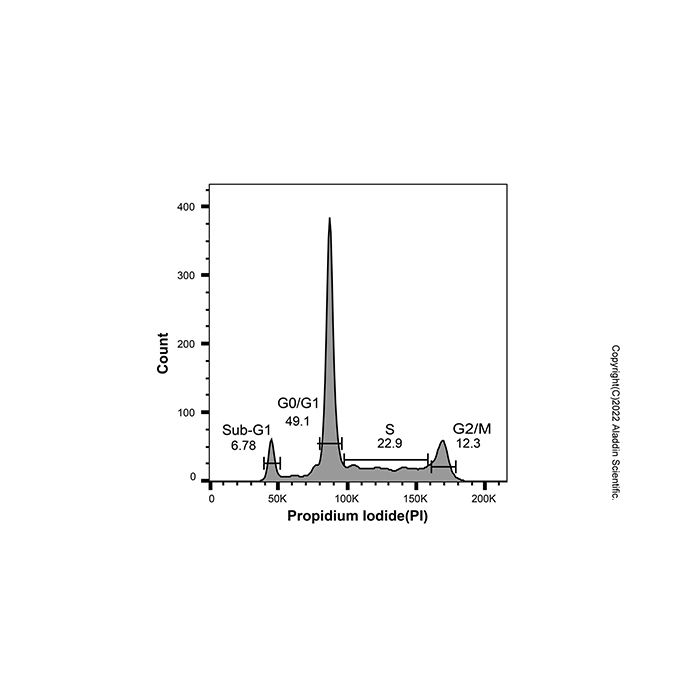
Cell Cycle and Apoptosis Detection Kit (P1373478) - Flow Cytometry
Jurkat cells were stained with the “Cell Cycle and Apoptosis Detection Kit” (P1373478). The resulting graph depicts the DNA content distribution of the cell population. Following overnight fixation in 70% ethanol, the cells were resuspended in a staining buffer containing Propidium Iodide (PI) and RNase A, and then analyzed.
In the graph, the horizontal axis represents DNA content (measured by PI fluorescence intensity), and the vertical axis corresponds to the number of cells. The distinct peaks and regions correspond to different phases of the cell cycle:
1. Sub-G1 phase: Apoptotic cells with fractional DNA content
2. G0/G1 phase: This peak corresponds to quiescent state or gap 1 (G1) phases, containing a diploid (2N) DNA content.
3. S phase: This region between the G0/G1 and G2/M peaks represents cells actively synthesizing DNA. Their DNA content varies between 2N and 4N.
4. G2/M phase: This peak corresponds to cells in the gap 2 (G2) and mitotic (M) phases. These cells have completed DNA replication and contain a tetraploid (4N) DNA content.

Documentation

📋 Safety Data Sheet (SDS)

Comprehensive hazard, handling, storage, and regulatory compliance document.

Download SDS →

✅ Certificate of Analysis (COA)

Lot-specific quality data. Enter your lot number to retrieve the exact COA.

Look up COA →

📊 Datasheet

Quick-reference summary of product specifications and applications.

View datasheet →

🔬 Specification Sheet

Full quality attributes and acceptance criteria for this grade.

View spec sheet →

Advanced Data

Certificates(CoA,COO,BSE/TSE and Analysis Chart)
C of A & Other Certificates(BSE/TSE, COO):
Analytical Chart:
Documents & Articles
Citations of This Product
References
1. Xiaoxiao Chen, Jing Tang, Shijie Zhan, Yixian Qiu, Jing Li, Weiguang Shan, Youmin Ying.  (2025)  Nagilactone C from the Seeds of Podocarpus nakaii May Protect Against LPS-Induced Acute Lung Injury via STAT Signaling Pathway Inhibition.  Pharmaceuticals,  18  (9): (1319).  [PMID:41011190] [10.3390/ph18091319]
Solution Calculators
Reviews

Customer Reviews

Shall we send you a message when we have discounts available?

Remind me later

Thank you! Please check your email inbox to confirm.

Oops! Notifications are disabled.