
Excel-based analysis of variance
Excel-based analysis of variance
Currently, there are three main Excel-based ANOVA methods: one-way ANOVA using Excel spreadsheets, two-way ANOVA without repeated observations based on Excel spreadsheets, and repeated information based on Excel spreadsheets such as cross-grouping ANOVA.
Principle
The basic principle of one-way ANOVA is that when k (k ≥ 3) overall means need to be compared, 1/2k (k-1) differences will be generated, and if these differences are to be tested one by one, the probability of committing a type I error will increase greatly with the increase of k, resulting in an increase in experimental error and a decrease in the precision of the estimate. Therefore, t-tests or u-tests cannot be directly applied for hypothesis testing between two-by-two means. For this reason, statisticians have proposed a method to test whether there are significant influences in the k ≥ 3 system, which in essence is a quantitative analysis of the causes of variation in the observations and is called analysis of variance (ANOVA).
(1) Linear model and basic assum ptions
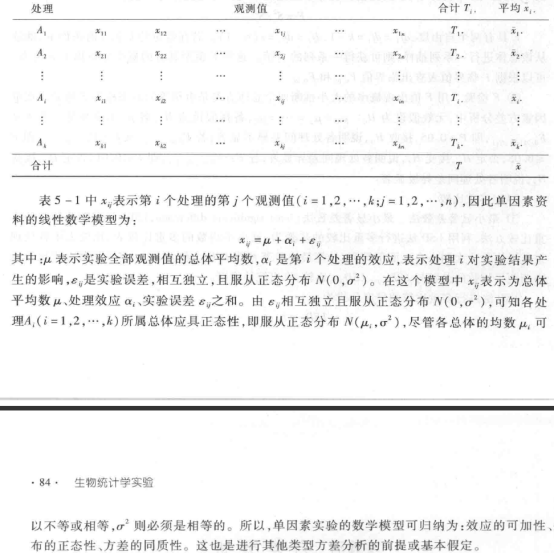
Suppose that a one-factor experiment has k treatments, n repetitions for each treatment, and a total of kn observations. The data structure of this kind of experimental data is shown in Table 5-1.
(2) Sum of Squares and Degrees of Freedom Profiles
① Dissection of the total sum of squares In Table 5-1, reflecting the total variation of all observations is the sum of the squared deviations from the mean of each observation, x, from the total mean, x, which is denoted as SSr, then there are:
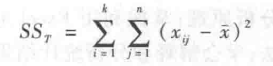
The decomposition is obtained:

② Segmentation of Total Degrees of Freedom In the calculation of the total sum of squares, each observation in the data is subject to the condition that "the sum of the off-mean deviations is 0", so the total degrees of freedom is equal to the total number of observations in the data minus 1, i.e., the total degrees of freedom, dfT = kn-1, can be segmented into two parts: inter-treatment degrees of freedom, dft = k-1 , and intra-treatment degrees of freedom, dfe = kn-k = k(n-1). The sum of the squares of the components divided by their respective degrees of freedom yields the total mean square, the inter-treatment mean square, and the intra-treatment mean square, denoted as MST, MSt, and MSe, respectively.
(3) F-distribution and F-test
In a normal population N (μ, σ2), k samples with sample content n are randomly selected, and the observations of each sample are organized into the form of Table 5-1. Thus, both  and
and  can be calculated as estimates of the error variance σ2 according to Eq. Find the ratio of
  as the denominator and
  as the numerator. Statistically, the ratio of two mean squares is called the F-value, i.e.:
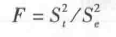
F has two degrees of freedom: df1 = dft = k-1 and df2 = dfe = k(n-1). If a series of samples from this aggregate are continued for a given k and n, a series of F values are obtained. The probability distribution of these F-values is called the F-distribution. The critical values F0.05 and F0.01 can be found in the table of critical values of F.
② F-test The method of inferring whether the variances of two populations are equal by the probability of the F-value appearing is called the F-test. In one-way ANOVA, the null hypothesis is H0: μ1 = μ2 = ..... = μk, and the alternative hypothesis is HA: the μi are not all equal. If F < F0.05 (df1,df2), i.e., P > 0.05, receive H0, indicating that the differences between treatments are not significant; if F0.05 (df1,df2) ≤ F < F0.01 (df1,df2), i.e., P ≤ 0.05, negate H0, accept HA, indicating that the differences between treatments are significant; if F ≥ F0.01 (df1,df2), i.e., P ≤ 0.01 , negate H0 and accept HA, indicating that the differences among treatments are highly significant.
(4) Multiple comparisons
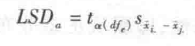
①Least significant difference method The least significant difference (LSD) method is the simplest method of multiple comparisons, and the steps of multiple comparisons using the LSD method are as follows: list the multiple comparisons table of means, and the treatments in the comparison table are arranged top-down according to their means from the largest to the smallest; compute the least significant difference LSD0.05 and LSD0.01; compute the least significant difference LSD0.05 and LSD0.01; and compute the least significant difference LSD0.01 and LSD0.01. LSD0.01; compare the difference between the two means in the table of multiple comparisons of means with LSD0.05 and LSD0.01, and make statistical inferences.
The scale formula for multiple comparisons of LSD method is:

② Duncan method The Duncan method considers the difference of the means as the extreme deviation of the means, and uses different test scales according to the number of treatments included in the range of the extreme deviation (called the ordinal distance) k, in order to overcome the shortcomings of the LSD method. These different test scales depending on the rank distance k at the significant level α are also called the Least Significant Extreme Variance LSR.
The formula is:

The basic principle of two-factor ANOVA is that when the trait under study is affected by two factors at the same time and two factors need to be analyzed at the same time, two-factor ANOVA can be performed. The relatively independent role of each factor is called the main effect of the factor (main effect); a factor in another factor at different levels of the effect of different, there is an interaction between the two factors, referred to as interactions (interaction). Interaction between factors is significant or not related to the utilization value of the main effect, if the interaction is not significant, then the effect of each factor can be added, the optimal level of each factor combined, that is, the optimal combination of treatments; if the interaction is significant, then the effect of each factor can not be directly added, the selection of the optimal treatment should be based on the direct performance of the combination of the treatment selected.
(1) Two-factor ANOVA without repeated observations
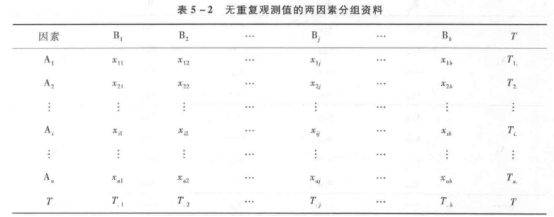
Unduplicated observations means that each treatment is not duplicated, i.e., assuming that there are a level of factor A and b levels of factor B, and there is only one observation for each treatment combination. The data structure of the unduplicated data is shown in Table 5-2.
The linear model for the observations in the two-way ANOVA is:

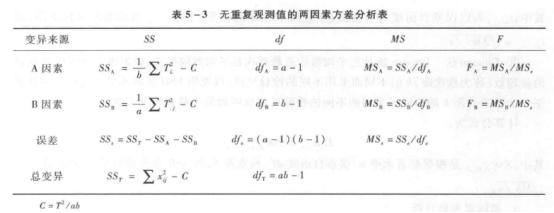
The results of the two-factor ANOVA with no replicated data can be summarized in the form of Table 5-3.
(2) Two-factor ANOVA with repeated observations
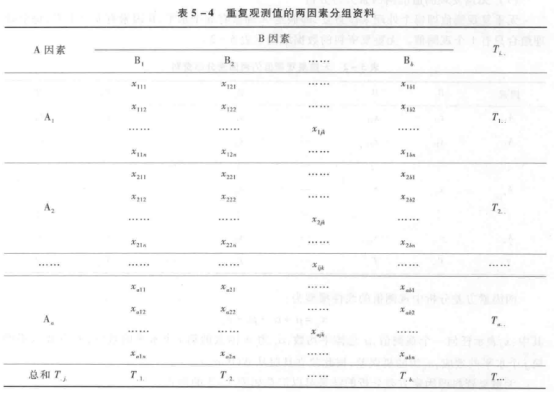
In a two-way ANOVA without repeated observations, the estimated error is actually the interaction of the two factors, and this result holds only if there is no interaction between the two factors, or if the interaction is small. However, if there is interaction between the two factors, the experimental design must be designed with repeated observations, which can estimate the interaction as well as the error at the same time. A typical design for a two-factor experiment with equal replicated observations is to design n replications for each combination of different factor levels, assuming that factor A has level a and factor B has level b. The data pattern is shown in Table 5-4.
The linear mathematical model for two-factor information with repeated observations is:

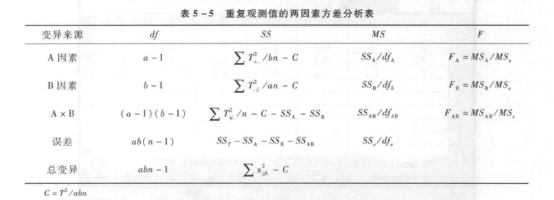
The results of the two-factor ANOVA for repeated observations can be summarized in the form of Table 5-5.
For more product details, please visit Aladdin Scientific website.