Intestinal permeability assay experiment
Intestinal permeability assay experiment
In the analysis of abnormal intestinal function due to intestinal inflammation, overall intestinal permeability can usually be evaluated by detecting intestinal absorption of fluorescently labeled macromolecular compounds into the bloodstream. An abnormal increase in permeability suggests abnormal intercellular junctions in the intestinal epithelium or the presence of an inflammatory lesion.
Principle
The basic principle of the intestinal permeability assay test is to evaluate the overall permeability of the intestinal tract by detecting the intestinal absorption of fluorescently labeled macromolecular compounds into the bloodstream.
Operation method
Intestinal permeability assay experiment
Principle
The basic principle of the intestinal permeability assay test is to evaluate the overall permeability of the intestinal tract by detecting the intestinal absorption of fluorescently labeled macromolecular compounds into the bloodstream.
Materials and Instruments
Equipment: Move The basic procedure of the intestinal permeability assay can be divided into the following steps: For more product details, please visit Aladdin Scientific website.
Fluorescent enzyme marker, fluorescent enzyme marker plate (black opaque).
Reagents:
① Fluorescein isothiocyanate-dextra (FD-4) (Sigma)
② physiological saline
A Mouse preparation Mice used for the determination of intestinal permeability should be fasted overnight to ensure that there is no excess food in the intestines to affect the intestinal wall's absorption of large fluorescent molecules.
B Dissolve FD-4 in sterilized saline (50 mg/ml), avoiding light, and weigh mice, and gavage them at 10 μl/g of body weight relative.
C 3 hours later, 200 μl of blood was taken from the eye socket and the serum was separated.
D Dilute the separated serum with saline in the ratios of 1:2 and 1:5.
E Dilute the remaining FD-4 used for gavage with saline starting at a starting concentration of 0.1 mg/ml, and dilute 4-fold downward for 6 points.
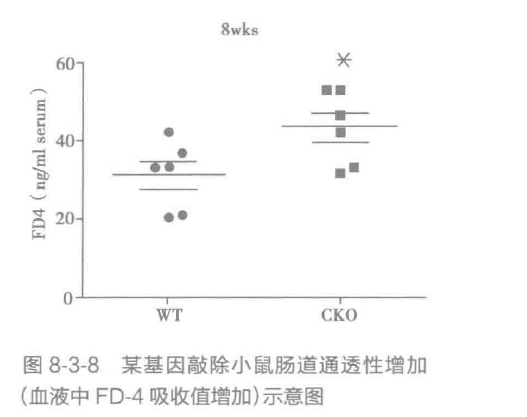
F Perform a simultaneous analysis of the standard curve for the absorption at 520 nm under 490 nm excitation light, graph and reduce to the original concentration. The standard curve was plotted and reduced to the original concentration and averaged. Examples of the results are shown in Figure 8-3-8.