
Multi-parameter data acquisition and analysis experiments on leukocytes
Multi-parameter data acquisition and analysis experiments on leukocytes
Several software packages are now available for flow cytometry data analysis. Although each one has a different approach in processing the data, the basic strategy is approximate. Since the analysis becomes more complex as the number of parameters increases, we concentrate on a classical means of analysis as well as an analysis method that can be generalized to various flow cytometry parameters.
Principle
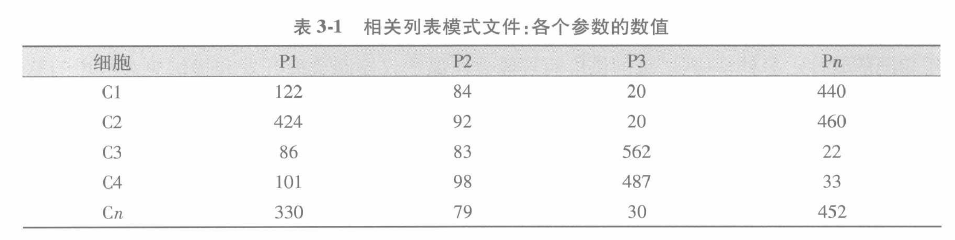
The basic principle of multi-parameter data acquisition and analysis experiments on leukocytes is that the parameter represents what is to be measured and the channel describes the value of the measurement. There are 3 parameters: Forward Scattering (FSC), Side Scattering (SSC), and Fluorescence.FSC is measured for laser beams ranging from 2° to 22° (depending on the device manufacturer) and is proportional to the cross sectional area of the particle being measured. It is only an assessment of particle size as other factors can affect the measurement.SSC is also called vertical or 90° scattering because it is measured at an angle of 90° to the laser beam and is sensitive to traits such as cellular granularity, which reflects the granularity index of intracellular particles as opposed to cytoplasmic components. Fluorescence intensity is also measured at an angle of 90° to the cell stream, and all soluble fluorescein used in the cell staining process is quantified. Currently the most commonly used fluorescein is coupled to a primary antibody, a secondary antibody, or to an affinity protein, and can be excited at 488nm or approximately 633nm. Antibodies can be coupled to fluorescein with different excitation or emission spectral characteristics. In order to separate the different colors, filters and dichroic prisms are used to reflect or project the non-specific wavelengths. Due to the wide range of fluorescence emission wavelengths, unwanted overlapping fluorescence needs to be removed by calibrating the instrument's compensation circuitry or by software-based fluorescence compensation. All flow cytometers collect data through a program called List Mode.1 A standard List Mode file consists of a header with information about the sample and instrument, followed by the data collected in sequence. The values stored in the list mode file are the electrically processed voltage values for each parameter from the monitor (Pl ,P2,P3,...). . . Pn). As shown in Table 3-1, the data in the list mode file shows the channel corresponding to each parameter, which represents the measured value for cell 1, 2, and so on up to the last cell n. The data in the list mode file are stored in the list mode file. If 6 parameters are measured for 10,000 cells, there will be 60,000 records in that order.
Operation method
Multi-parameter data acquisition and analysis experiments on leukocytes
Principle
The basic principle of multi-parameter data acquisition and analysis experiments on leukocytes is that the parameter represents what is to be measured and the channel describes the value of the measurement. There are 3 parameters: Forward Scattering (FSC), Side Scattering (SSC), and Fluorescence.FSC is measured for laser beams ranging from 2° to 22° (depending on the device manufacturer) and is proportional to the cross sectional area of the particle being measured. It is only an assessment of particle size as other factors can affect the measurement.SSC is also called vertical or 90° scattering because it is measured at an angle of 90° to the laser beam and is sensitive to traits such as cellular granularity, which reflects the granularity index of intracellular particles as opposed to cytoplasmic components. Fluorescence intensity is also measured at an angle of 90° to the cell stream, and all soluble fluorescein used in the cell staining process is quantified. Currently the most commonly used fluorescein is coupled to a primary antibody, a secondary antibody, or to an affinity protein, and can be excited at 488nm or approximately 633nm. Antibodies can be coupled to fluorescein with different excitation or emission spectral characteristics. In order to separate the different colors, filters and dichroic prisms are used to reflect or project the non-specific wavelengths. Due to the wide range of fluorescence emission wavelengths, unwanted overlapping fluorescence needs to be removed by calibrating the instrument's compensation circuitry or by software-based fluorescence compensation. All flow cytometers collect data through a program called List Mode.1 A standard List Mode file consists of a header with information about the sample and instrument, followed by the data collected in sequence. The values stored in the list mode file are the electrically processed voltage values for each parameter from the monitor (Pl ,P2,P3,...). . . Pn). As shown in Table 3-1, the data in the list mode file shows the channel corresponding to each parameter, which represents the measured value for cell 1, 2, and so on up to the last cell n. The data in the list mode file are stored in the list mode file. If 6 parameters are measured for 10,000 cells, there will be 60,000 records in that order.
Materials and Instruments
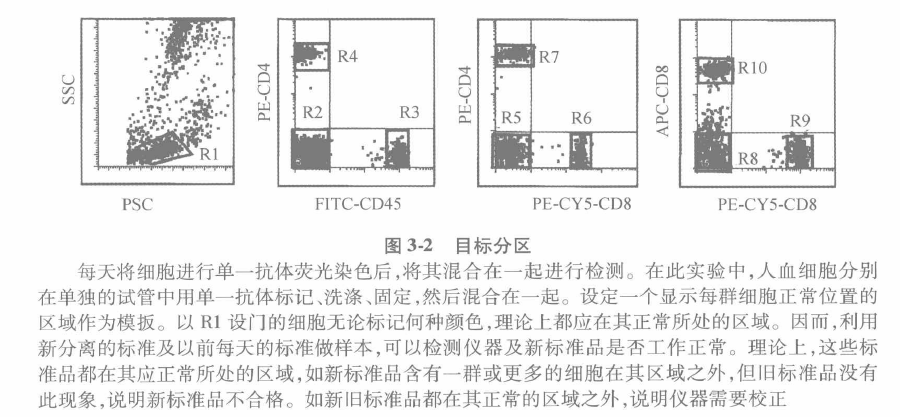
Equipment: flow cytometer with corresponding computer and software, standard microspheres for correction. Move The basic process of collecting and analyzing multi-parameter data of leukocytes experiment can be divided into the following steps: A Before collecting data, it is of utmost importance to first assess the condition of the instrument. An easy and simple way to achieve this is by comparing the day's and previous operations. The average fluorescence intensity and coefficient of variation are usually evaluated and determined using high quality microspheres. B A threshold value is set for each functional parameter. When the measured value falls outside the threshold, a correction must be made. Figure 3-1 shows an example of the FACSCalibur being used every day for 1 year. To ensure operational stability, instrument care and maintenance need to be established and maintained. C Because flow cytometers are used to measure cells, the final confirmation of an operation is also cell-based. Care should be taken when using it to select cells whose determination matches that of the instrument. D As shown in Figure 3.2 during immunophenotyping, cells are stained with fluorescent antibodies and their fluorescence intensity is measured. Circle 1 the area where the target cells are located as a template to be used every day. All the different cells should be present in their respective regions. These simple tests ensure that the instrument works daily and that there is good consistency in the data regardless of when it is acquired.
Reagents:
① Leukocytes of a certain origin.
② Fluorescent coupled antibodies that can be used to detect the leukocyte population described above.
③ Solutions and reagents required for cell staining.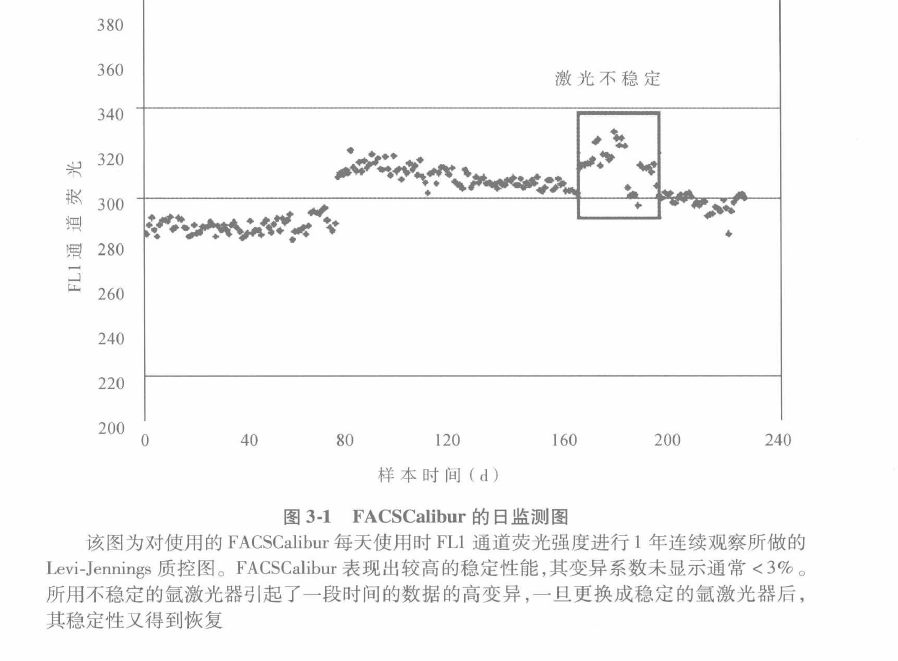
(ii) Data Display
A Univariate Histogram
The univariate histogram shown in Figure 3.3 is the simplest way to display data. It is a frequency distribution graph where the y-axis or vertical coordinate represents the number of cells and the x-axis or horizontal coordinate represents the measurement (channel). Usually, immunofluorescence is displayed as a logarithmic value. This is because it is possible to span 3 to 4 orders of magnitude in intensity. Therefore, the instrument monitor must be adjusted so that the fluorescence values of uncolored cells are within the lowest logarithmic range (Figure 3-3A, channels 1-10).

(ii) Establish a cutoff value such that cells to the right of it can be determined to be positive for fluorescent antibody staining. This is usually done using isotype control immunoglobulin (isotype Ig), which is known to bind without affinity to cells and therefore serves as a non-specific IgG; however, this is often overlooked, incorrectly assuming that the vendor has set up the appropriate isotype control. As shown in Figure 3-3B, cells fluoresce more intensely than autofluorescence due to non-specific binding of antibodies or binding of Fc receptors. Sequestering the cellular epitope with the appropriate dose of IgG reduces Fc receptor binding, but does not reduce nonspecific binding. The cut-off value is set to distinguish between positive and negative cells and to limit the positive peak to 0.5% to 2% for negative cells. However, this univariate histogram is not sufficient for analyzing a very small number of cells.
(iii) According to the majority opinion and the NCCLS document, it is recommended that cells staining negative for a specific antibody be used as isotype controls for experiments. This is also recommended here, because any antibody has a specific, unchanging affinity, which determines the concentration and specificity of the antibody to be used. In addition, since IgG binds both specifically and non-specifically, it should be used as its own isotype control.
B Gating
Gating is the process of analyzing a restricted portion of a flow file, such as a population of cells. A region is used to define the cell population of interest. These regions are defined by upper and lower boundaries. The most commonly used are the FSC and SSC parameter gates, as shown in Figure 3-4. However, this strategy still has the drawback of taking for granted that the cells of interest are within the circled region, which will be discussed in more detail below.
Using the univariate histogram shown in Figure 34, we can analyze the data by setting gates through the cells. In Fig. 3-4A, two regions, R1 and R2, are used to represent small and large cell populations, respectively, so that the proportion of cells falling within the bounding regions of R1 and R2 can be calculated in the forward scattering histogram. At the same time, the histograms of the fluorescence intensity of all cells, cells in the R1 setup gate, and cells in the R2 setup gate can also be displayed, as shown in Figure 3-4B, Figure 3-4C, and Figure 3-4D, respectively. This process is called gating, because the measurements we get depend on the region of interest (small or large cells). Only cells that fall within the gated area are displayed.
② As shown in Figure 3-4C from the R1 gating, we see two histograms with very different fluorescence intensities, somewhat similar to the negative and strongly positive cell populations in Figure 3-4B. The one on the left is a negative cell population and the one on the right is a positive cell population, so it is easy to distinguish the positive from the negative. The histograms in Figures 3-4D are the results from the R2 gate, and only one cell population is represented by the middle group of positive cells in Figures 3-4B with the darker fluorescence.

C Bivariate Distribution Plots
When a bivariate histogram is generated by collecting cells with two parameters, all possible combinations can be displayed. The four quadrants, shown in Figure 3-5, represent the results of two combinations of positive and negative cells. The distinction between monochromatic bright and dim fluorescence is not possible for this analysis. There are 4 possible combinations of staining with two antibodies: +-, + +, - + and - -. A bivariate histogram can be used to visualize all four cases, as shown in Figure 3-5.

(1) When one univariate histogram is distributed on the valence axis and the other univariate histogram is distributed on the cadaver axis, a bivariate histogram is produced (Figure 3-6).
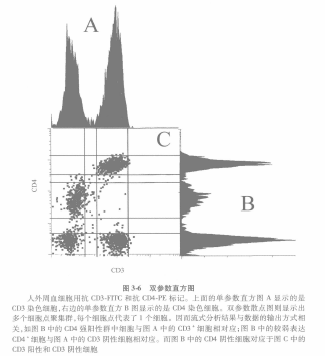
(ii) If each of these two univariate histograms is projected in the middle of the two parameter display plots, the values of the clusters produced by the cells together are represented by dots. Each dot represents a cell. Cells that share common characteristics will appear as overlapping dots forming clusters. These clusters can have different shapes and sizes depending on the correlation between the two antibodies. This is due to the fact that the data are correlated in the list pattern file.
In addition, the data can be further analyzed. For example, cells with strong CD4 fluorescence are also CD3-positive, while those with weak CD4 fluorescence do not express CD3 molecules, and CD4-negative cells can be either CD3-positive or CD3-negative. The CD4-negative cells can be either CD3-positive or CD3-negative, so that the three groups of cells shown separately on a univariate histogram can be shown together on a bivariate histogram.
④ It is common practice to gate the bivariate scatter plot with FSC and SSC to delineate areas around lymphocyte aggregates. This method assumes that all lymphocytes fall in this cluster and that all cells inside this cluster are lymphocytes. However, as shown in Figure 3-7, this is not the case. The purity of the acquired cells needs to be evaluated for any region of the gate. Figure 3-7A shows three fairly well-defined clusters, L for lymphocytes, M for monocytes, and G for granulocytes. The bivariate histogram shown in Figure 3-7B can be seen if CD45 and CD14 are used as the staining color.
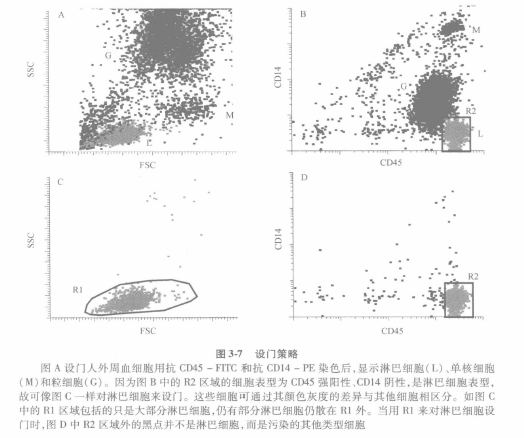
⑤R2 reflects the CD45 hiCD14-lymphocyte population. r2 is a gate for the forward-lateral scatter scatter plot in Fig. 3-7C. R2 is a gate in the forward-lateral scatter plot in Figure 3-7C. R1 in Figure 3-7C is set to lymphocytes, whose CD45 and CD14 expression is shown in Figure 3-7D. Cells that are in the R1 region but outside the R2 region are not lymphocytes. If the R1 gate is set too large, the purity of lymphocytes will be reduced by including some impure cells. Figure 3-7D shows that 7.5% of the gate is contaminated cells. If the purity of the lymphocytes is low, e.g. <90%, it is possible to reduce the size of R1, but this will result in a loss of lymphocytes. However, as long as only a small number of lymphocytes are lost in return for a large increase in purity, this is recommended to obtain an ideal lymphocyte gate, also known as a lymphogate. o This lymphogate, once established in the forward-lateral scatter plot, can be used for all subsequent sample analyses. The same strategy can be used when analyzing monocyte or granulocyte populations (Figure 3-7A).
D Color Setting Gate
The analysis also becomes more complex when there is a third color, because there are three pairs of bivariate variables that describe the fluorescence data, such as those shown in Fig. 3.8. As defined by the usual terminology, these are AB1-FITC (FL1) with AB2-PE ( FL2), AB1 -FITC ( FL1) with AB3-PC (FL3), and AB2-PE (FI2) with AB3-PC (FL3). In this way, there will be 3 scatter plots, so we need to be able to show the position of the same group of cells in different 2D plots. To do this, we can use color gating, i.e., each color is assigned to a gate.
In Figure 3-8A, the black color shows the cell population of FL1 versus FI2. If you look at FL2 vs. FL3 (Fig. 3-8B), or FL1 vs. FL3 (Fig. 3-8C), this group of cells could be anywhere else.
(ii) As shown in Figure 3-8A, only a single cell population is seen, but in Figure 3-8B, there are 2 different cell populations, one is AB3-PC negative and the other is AB3-PC positive. Since in Figure 3-8A we defined the cellular gate as black, in Figure 3-8B, both cell populations are black, even though they are AB2-PE+AB3-PC- and AB2-PE+ AB3-PC+, respectively. This situation can be corrected by defining the AB2-PE+ AB3-PC- cluster as gray.
(iii) In Figure 3-8C, we see 2 cell populations that are both AB1-FITC+, but AB3-PC - is gray. Thus, the gray cell populations are AB1-FITC+ AB2-PE+ and AB3-PC-, while the black cell populations are AB1-FITC+ AB2- PE + AB3-PCL. Therefore, for automated analysis of data with a large number of parameters (3 or more), this color gating is a preferred strategy.
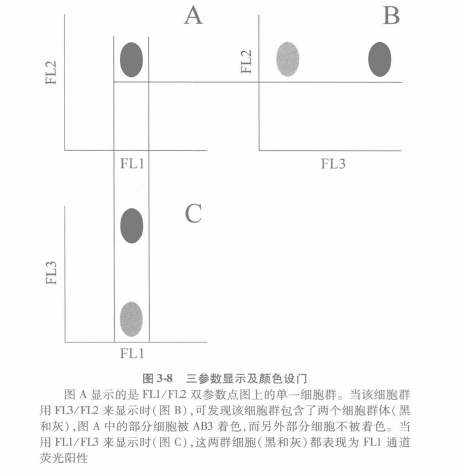
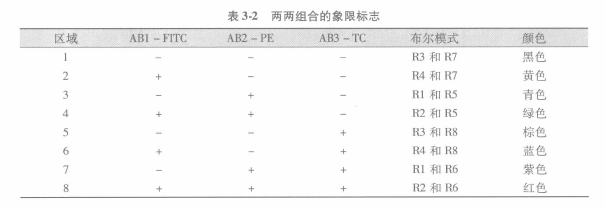
Figure 1 shows an example of a two-dimensional color-gated analysis using three different antibodies. From R1 to R8, each quadrant represents a region. To show 3 2D combinations of these 3 fluorescent antibodies, all possible combinations can be displayed with just two scatter plots. Any two combinations are sufficient, such as in this case CD3-FITC with CD4-PE, and CD8-PC with CD4-PEO As shown in Table 3.2, there are a total of 8 possible two-dimensional combinations based on whether any given cell is positive or negative for a particular antibody (Table 3.2).
⑤ Cells of any phenotype can be clearly distinguished by using Boolean algebra to partition the region of the combination. Cells that are not stained can only be in the R3 and R7 regions. We cannot use only R3, because these cells are also present in the R7 or R8 regions. For the same reason, if we use only R7, these cells can also be found in the R3 or R4 region. Therefore, according to the Boolean equations R3 and R7 clearly define the cells that are negative for all three antibodies. This logic can be used for the other seven possible two-dimensional combinations.
(6) Note the arrangement of the data in the table. The order of the first column is -+ - + , and so on; while the second column is - - + + + -- + + +, and so on; and the third column is ----+ + + + + - - + + + + +. If another parameter is added, we simply double this number of clusters, so the number of two-dimensional combinations represents the number of antibodies (parameters). 8 parameters produce 256 cell clusters. Each combination produces its own unique color phenotype,
like FITC-CD3, PE-CD4, and PC-CD8 in Figure 1 shown in the last column of Table 3-2.
The usual strategy for data analysis is the "labeling" method. The four quadrants of a two-dimensional histogram represent negative, single-positive and double-positive cells, so that the four groups of cells distinguished by the two antibodies can be easily distinguished. When more than two fluorescent colors are used, multiple 2D scatter plots are required. Color Figure 2 shows what happens when four antibodies are used simultaneously. Note that as each new parameter is added, the complexity of the data increases and the number of 2D scatterplots required increases accordingly.
The usual procedure is to first perform scatter plots for forward and side scatter, then circle the cell population of interest, e.g., lymphocytes, and then set the gate using fluorescence. As we have discussed, not all cells of interest may be circled, and stray cells may be mixed in. This led to the realization that it might be better to perform "cell gating".
Basically, one or more antibodies are needed to define cells for gating analysis. For example, CD45 defines all leukocytes, CD3 defines T-cells, CD19 represents B-cells, CD56 + CD3 - represents NT-cells, CD14 defines monocytes, and CD34 defines precursor cells. With this in mind, side-scattering (linear or logarithmic) and fluorescent antibodies are used to sort out the cell population of interest. A group of positive cells can be circled and then gated using forward/lateral scatter and fluorescence. The advantage of this is that only one region of an antibody is required and any one region or combination is a defined cell setup gate.
This feature has been integrated into the idea of data analysis and can be used against any number of fluorescence parameters. As the number of parameters increases, it becomes relatively easy to analyze, as shown in Figure 3-9, which is an example of distinguishing lymphocyte subpopulations from human peripheral blood, such as T cells, NK cells, and B cells.
A General Phenotype Diagram
① During four-color analysis, 1 area of positive cells is delineated using side scatter and fluorescence parameters to distinguish each fluorescence (Fig. 3-9). Negative cells (best control), which serve as isotype controls or autofluorescence can be used to define the negative population.
② Next, the combination of forward scatter and side scatter shows the population of positive cells (R1-R4) obtained in the combination of side scatter and antibody. This provides the scattering characteristics of the positive cells and also reveals previously unknown cell populations. Another region, R5, is used to enumerate a specific cell population while generating R5 set gates and tiles (here i = 1,2,3,4).
(iii) Color figure 3 shows all the fluorescence combinations. These two-dimensional graphs can be the result of any desired combination of one fluorescence and forward/lateral scattering. Here, a CD45+ cell (R4 in Fig. 3-9) was used to show the scattering characteristics of a monocyte (R5 in Fig. 3.9), resulting in R4 and R5. Clearly, any region can be gated by either scattering or fluorescence when analyzing the data.
In order to visualize the cell subpopulations in all two-dimensional combinations, color gating was used for each two-dimensional combination. Our strategy is to assign colors to guarantee all possible phenotypic combinations. For example, in the case of a three-color combination, red is used to represent all 3 antibody positives (+ + +). Thus, in a 2D histogram, cells that are positive for all 3 antibodies are shown as red clusters.
B Color Gating for Four or More Colors
Color gating does not work for parameters with four or more colors because most people cannot distinguish between 11 or 12 colors (e.g., red, yellow, orange, green, blue, purple, brown, gold, cyan, fuchsia, gray, and black). Although it is possible to distinguish a pair of colors by shading, this cannot be easily detected in a color chart. As a result, the 5 colors produce 32 two-dimensional combinations, requiring 32 colors that are indistinguishable from each other.
To solve this problem, we reuse colors up to a maximum of 8. Figure 2 shows an example. Eight colors are used to represent a four-color fluorescence analysis, and these eight colors can be reused in another layer of analysis.
(ii) Five-color fluorescence may require four analyses, each using the same eight colors. Therefore, select one or more fluorescence parameters to gate sequentially for n independent analyses. Considering the purpose of the antibody combination, it is necessary to select the appropriate fluorochrome-labeled antibody, the appropriate color combination, and the cellular gating strategy.
Although there is no lower limit to the complexity of multiparameter data analysis, this method provides a simple strategy for processing data regardless of the number of parameters. As a result, the complexity of the data increases, but the means of analysis remains simple. We call this process cell gating because only those cells that meet the criteria are screened and quantitatively evaluated.
Caveat
Antibody combination strategies. There are two main aspects that need to be considered to determine what antibodies should be combined: technically and scientifically.1 Technical considerations① Technically speaking antibodies guarantee correct results. Antibodies against different epitopes of the same antigen may block each other, or else they may produce incorrect fluorescence compensation, leading to incorrect interpretation of the results.The intensity of antigen expression and fluorescence should also be taken into account. The general principle is to use the strongest fluorescein such as PE or its tandem to label low expression antigens, and choose a weaker fluorescein such as FITC or PerCP to label high expression antigens. APC is a weak fluorescein, but is used in low expression cells due to the fact that there is very little autofluorescence at its excitation wavelength, which results in a high signal-to-noise ratio. It is also important to note that the increase in color and, accordingly, the compensation becomes more stringent making quadrant analysis more difficult. Also, the above method can still be used when the gate is set up with a folded line rather than a rectangular frame.2 Scientific considerationsThis aspect is based on the ability of the immunophenotyping assay and the combination of antibodies chosen to clearly answer the question to be addressed, and therefore requires the use of a lineage-specific antibody in combination with an antibody that binds to the antigen of interest for recognition. For example, to analyze the expression of chemokine receptors by T cells, CD3 can be used to define T cells and be combined with a chemokine receptor antibody.② Analyzing cells of interest but low frequency requires the use of a set of antibodies to remove those cells that are not of interest and the associated background they bring. For example, dendritic cells are low frequency cells in the blood. Since dendritic cells do not express CD3, CD14, CD19, and CD56, these antibodies can be used in combination with the same fluorescent marker, e.g., FITCO. In addition, since dendritic cells express CD123-PE, HLADr-PerCP, and CDllc-APC, the four-color combination can accurately differentiate between the dendritic cells, i.e., CD123+ , HLADR+ , CDllc+ , and CDllc+ . CD123+ ,HLADR ,CDllc+ , while CD3, CD14, CD19 and CD56 are negative.
For more product details, please visit Aladdin Scientific website.