
Esters, F/P Calculation, and Troubleshooting Guide
Whether you are using Super Fluor, Alexa Fluor, or a traditional Cy series dye, as long as the reagent is an NHS ester (N-hydroxysuccinimide ester), you are essentially relying on the same underlying chemistry and the same “rules of the game” for amine labeling.
This article does not focus on any single dye. Instead, it aims to address three more fundamental questions:
1. Under what conditions do NHS esters react efficiently?
2. After labeling, how should F/P (Dye/Protein) be calculated, and what range is considered appropriate?
3. How can common issues (low labeling, over-labeling, high background) be systematically troubleshot?
When you later change dyes, switch vendors, or even move to other NHS-based reagents (such as biotin or crosslinkers), the concepts presented here should still apply. The goal is to help you develop a set of “general operating principles” that can be transferred across different dyes and different projects.
The Underlying Logic of NHS Ester Labeling: pH, Reactive Sites, and Buffer
1. Reaction Target: Primary Amines on the Protein
NHS esters are classic amine-reactive reagents. They react with primary amines (–NH₂) on proteins to form stable amide bonds, primarily at:
1. The ε-amino group of lysine side chains;
2. The N-terminal amino group.
Therefore, proteins with many accessible labeling sites and lysine residues (such as IgG) are well suited for NHS ester labeling.
2. Why Is the pH Almost Always “Around 8.3”?
Labeling efficiency is extremely sensitive to pH:
1. pH too low:
Primary amines are protonated to –NH₃⁺ and barely participate in nucleophilic substitution, resulting in very poor labeling efficiency.
2. pH too high:
Although primary amines are highly nucleophilic, the NHS ester is rapidly hydrolyzed, which shortens the effective reaction window.
Empirical data from multiple manufacturers point to a similar range: pH 8.3–8.5 is a comfortable operating window for NHS ester labeling.
A common practical approach is:
1. First dissolve the antibody in PBS at pH 7.2–7.4;
2. Then add a small amount of 1 M NaHCO₃ / carbonate buffer to adjust the reaction mixture to approximately pH ~8.3.
3. Components That “Must Not Appear” in the Buffer
General principle: the reaction mixture must not contain primary amines that can react with the NHS ester in competition with the protein. Therefore:
1. Avoid:
1. Buffers containing primary amines, such as Tris or glycine;
2. High concentrations of ammonium salts, such as ammonium chloride or ammonium acetate.
2. Recommended:
1. PBS / HEPES / other phosphate buffers, with pH adjusted using NaHCO₃ / Na₂CO₃.
3. Low-concentration preservatives:
1. Small amounts of NaN₃ or thimerosal generally do not significantly affect NHS reactions at millimolar levels.
If a commercial antibody is supplied in a buffer containing Tris, glycine, or high concentrations of ammonium salts, it is best to perform dialysis or desalting on a G-25 / P-30 column into PBS before labeling.
How to Design a Robust NHS Labeling Reaction
1. Protein concentration: problems when it is too dilute
Most manufacturers recommend a protein concentration of ≥ 1–2 mg/mL. For IgG labeling, 2–10 mg/mL is a common working range:
1. If the protein is too dilute:
1. The reaction proceeds slowly and the dye is more prone to hydrolysis;
2. After labeling, column purification or dialysis must be performed on a large, dilute volume, resulting in poor recovery.
2. A more practical approach:
1. Concentrate or ultrafilter the antibody to 2–5 mg/mL before performing the labeling reaction.
2. Dye-to-protein molar ratio: where to start?
A typical starting range (taking antibodies as an example) is:
1. For general IF / flow cytometry / ELISA:
Start with a Dye:Protein ratio of approximately 5–10 : 1.
2. For antibodies that must retain high activity or for in vivo applications:
A more conservative 2–5 : 1 is commonly used.
When labeling a new antibody for the first time, it is advisable to run several small-scale reactions in parallel (for example, 3×, 6×, and 9× molar excess of dye) and then select the “optimal condition” based on the resulting F/P value and functional performance.
3. Reaction conditions: time and solvent
General settings:
1. Temperature: room temperature (20–25 °C);
2. Time: 30–60 min (some manufacturers recommend 15–30 min);
3. Solvent:
1. First dissolve the dye in anhydrous DMSO or DMF to prepare a concentrated stock solution;
2. When adding to the protein solution, keep the final volume fraction of organic solvent below 10% to avoid protein denaturation.
After the reaction, the first step is not to immediately calculate the F/P. Instead, you should first thoroughly remove free dye by dialysis or using a G-25 / P-30 desalting column.
A Unified Method for Calculating F/P (Dye/Protein)
Whether you are using Super Fluor 488, AF594, or any other NHS dye, the calculation of F/P follows the same set of formulas. Below is a “universal version” that you can literally paste into your lab notebook.
1. Preparatory steps
Before calculating F/P, complete the following:
1. Purify the conjugate after labeling
Remove free dye thoroughly by dialysis, or by using Sephadex G-25 / P-30 / pre-packed desalting columns.
2. Dilute to an appropriate OD range with PBS.
3. Measure two absorbance values in a 1 cm pathlength cuvette:
A₍₂₈₀₎: main absorbance of the protein;
Amax: absorbance at the dye’s maximal absorption wavelength (for example, Super Fluor 488 at 494 nm, a 680 dye at 680 nm, etc.).
1. Have the following known parameters ready:
(1) The molar extinction coefficient of the protein at 280 nm, εprot
(for standard IgG, εprot ≈ 203,000 M⁻¹·cm⁻¹);
(2) For the dye:
(1) The molar extinction coefficient εdye at λmax, and
(2) The 280 nm correction factor CF₂₈₀.
These values are usually provided on the COA.
(Different dyes can have very different CF₂₈₀ values; they are not interchangeable and you must use the value listed for the specific dye lot.)
2. Step One: Correct for the dye’s contribution at 280 nm
Because the dye also absorbs at 280 nm, you must subtract this contribution using CF₂₈₀:

3. Step Two: Calculate protein and dye concentrations
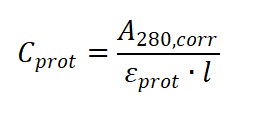
Apply the Beer–Lambert law:
Protein concentration (molar):
Dye concentration (molar):
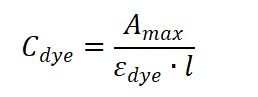
where is the optical pathlength (typically 1 cm).
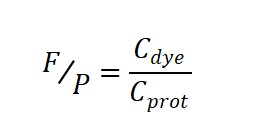
4. Step Three: Calculate F/P = Dye/Protein
Finally, take the ratio:
What Is an “Appropriate” F/P Value? — Reference Ranges for Different Applications
Different applications have different requirements for the degree of labeling (DOL, i.e., F/P), but there is a general consensus:
1. If F/P is too low
a) Too few dye molecules are attached per antibody molecule, resulting in weak signal and the need for high dosing or long exposure times.
2. If F/P is too high
b) The antibody surface becomes “covered” with dyes, which promotes aggregation and self-quenching, and leads to reduced affinity and specificity.
Many sources provide the following empirical ranges:
1. In vitro applications — routine IF / flow cytometry / ELISA (using IgG as an example):
a) An F/P of 3–8 moles of dye per mole of antibody is a commonly targeted range.
b) For “ultra-bright” applications, F/P can sometimes be pushed to 8–10, but functional loss must be monitored carefully.
2. In vivo applications (in vivo imaging):
a) More conservative ranges such as 1.5–3 or 2–4 are generally preferred, to maintain adequate signal while minimizing impact on the antibody’s in vivo behavior.
In practice, the most reliable approach is to prepare several small batches of the same antibody with different F/P values and compare them side by side. By evaluating signal-to-noise ratio, binding affinity, and biological readouts, you can determine the “optimal F/P window” for your specific application.
Common Problems and Troubleshooting
1. Labeling efficiency too low (F/P < 2 or close to 0)
Common causes:
1. pH is too low (< 7.5), so primary amines are protonated;
2. The buffer contains Tris / glycine / high concentrations of ammonium salts that compete with the protein for reaction;
3. Protein concentration is too low (≤ 1 mg/mL), leading to insufficient effective local concentration;
4. The dye has partially hydrolyzed (DMSO stock stored for too long or opened too many times);
5. The actual dye:protein molar ratio is too low, or the reaction time is too short.
Recommended actions:
1. Adjust the reaction pH to around 8.3 (PBS + NaHCO₃);
2. Desalt the sample into PBS / phosphate buffer before labeling;
3. Increase the protein concentration to 2–5 mg/mL;
4. Use freshly prepared NHS dye stocks in DMSO; discard stocks that have been stored for a long time;
5. Increase the D:P ratio as appropriate (e.g., from 3× to 6×), or extend the reaction time to 60 min.
2. Over-labeling (F/P > 8–10): aggregation, loss of activity, quenching
Typical observations:
1. SDS-PAGE of the labeled antibody shows abnormal high-molecular-weight aggregate bands;
2. Binding activity is clearly reduced (IF / flow signals become “dirty” with high nonspecific background);
3. Total fluorescence per mole of antibody is actually lower than that of batches with moderate F/P, indicating self-quenching.
Recommended actions:
1. Reduce the D:P ratio used for labeling (for example, from 10× down to 3–5×);
2. Shorten the reaction time (for example, from 1 h down to 20–30 min);
3. For batches that are already over-labeled, you may:
1. Mix them with an appropriate proportion of unlabeled antibody before use;
2. Use more conservative D:P ratios in subsequent preparations.
3. High background: incomplete removal of free dye
Typical symptoms:
1. In flow cytometry or imaging, “almost all cells” appear fluorescent;
2. Under transmitted light, the sample looks intensely colored, but the protein content is not particularly high;
3. In small animal imaging, strong whole-body fluorescence appears early, with an unusually bright bladder.
Key checkpoints:
1. Was desalting/dialysis performed thoroughly before calculating F/P?
2. Is the G-25 / P-30 column too small or too short, resulting in incomplete separation?
3. Was only a single quick desalting step performed, with no repeated or extended dialysis?
Solutions:
1. Run the sample again on a G-25 / P-30 column with an appropriate bed volume, and monitor each fraction by both Amax and A280;
2. Alternatively, switch to dialysis (with multiple buffer exchanges) until the external buffer shows almost no residual dye color.
4. Loss of antibody function or large batch-to-batch variation
Possible causes:
1. Labeling sites happen to be located near or within the antigen-binding region;
2. Small differences in pH, D:P ratio, or reaction time between batches lead to changes in F/P and in the distribution of labeling sites;
3. Improper storage conditions (repeated freeze–thaw cycles, light exposure) cause the antibody itself to lose activity.
Recommended practices:
1. For a given antibody, define a relatively narrow target F/P range (for example, 2–3 or 3–5);
2. Standardize labeling conditions as much as possible: fix pH, reaction time, D:P ratio, and temperature;
3. For critical projects, perform both F/P determination and functional testing (e.g., MFI in flow cytometry) for every labeled batch.
Aladdin: https://www.aladdinsci.com/