610M Multi Wire Myograph System: This system is suitable for the simultaneous study of 1 to 4 small vessels with diameters ranging from 60 μm to 10 mm, and is particularly suitable for the study of vascular pharmacology and physiology.
Principle
The basic principle of the 610M Multi-Channel Vascular Tensiometer for measuring vascular tone in mice is to monitor changes in vascular tone by means of two tiny wires passing through the inner lumen of a small chamber immobilized in oxygenated saline solution at a constant temperature. The whole process of vasoconstriction and diastole after the addition of different drugs is inputted into the computer through the tension sensor, and the recording of the tension changes of the vascular wall is completed under the control of the computer program.
Operation method
610M Multi-Channel Vascular Tensiometer Measures Vascular Tone in Mice
Principle
The basic principle of the 610M Multi-Channel Vascular Tensiometer for measuring vascular tone in mice is to monitor changes in vascular tone by means of two tiny wires passing through the inner lumen of a small chamber immobilized in oxygenated saline solution at a constant temperature. The whole process of vasoconstriction and diastole after the addition of different drugs is inputted into the computer through the tension sensor, and the recording of the tension changes of the vascular wall is completed under the control of the computer program.
Materials and Instruments
Equipment: Move The basic process of measuring vascular tone in mice with the 610M Multi-Channel Vascular Tensiometer can be divided into the following steps: For more product details, please visit Aladdin Scientific website.
Surgical instruments, membranous cataract scissors, microforceps, dissecting scissors, ophthalmic forceps, 610M Multi Wire Myograph System (610M Multi Wire Myograph System).
Reagents:
① H-T buffer: NaCl 137 mmol/L; KCI 4 mmol/L; CaCl2
2 mmol/L; MgCl2
NaCl 137 mmol/L; KCI 4 mmol/L; CaCl2 2 mmol/L; MgCl
2 mmol/L; MgCl2
2 mmol/L; glucose 5.6 mmol/L; HEPES 5 mmol/L, neutralized to pH 7.4.
② KCI H-T buffer: NaCl 15.7 mmol/L; KCI 124 mmol/L; CaCl
2
1.0 mmol/L; MgCl
2
2.0 mmol/L; glucose 5.6 mmol/L; HEPES 10 mmol/L, neutralized to pH 7.4.
A Separation of blood vessels Remove the vascular tissues of the mice after execution and place them in physiological solution, and then separate the small blood vessels from the surrounding tissues under the dissecting microscope (be careful not to use excessive force, so as not to injure the vascular and muscular tissues).
B Move the cleanly separated blood vessels to the physiological solution in the bath, and then cut a fine steel wire (smaller than the diameter of the bath to facilitate operation) of 2~3 cm. Cut a 2~3 cm thin steel wire (smaller than the diameter of the bath to facilitate operation), gently hold the vessel wall with microscopic forceps, and thread the thin steel wire into the vessel carefully, then use a screwdriver to fix the steel wire on both sides of the screws, and then use the same method to insert another steel wire to fix the vessel in the water bath, as shown in Fig. 8-5-4. 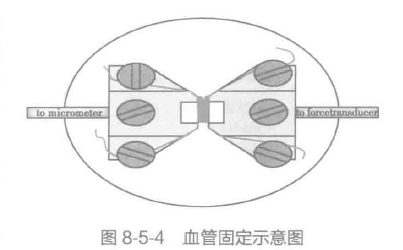 C Open the Chart software, turn on the oxygen and temperature switch, and equilibrate the vessel for 30 minutes under the condition of supplying oxygen at 37℃. D Base tension conditioning
D The basal tension adjustment was equilibrated to the level of the tension curve and zeroed. Then, adjust the vessel diameter by means of a spiral micrometer, and adjust the vessel wall pressure to 13.3 kPa (100 mmHg) at a frequency of 1 μm at a time and at 1-minute intervals, and the value of X1 will be the desired inner diameter of the vessel under basal tension, as shown in Figure 8-5-5a. 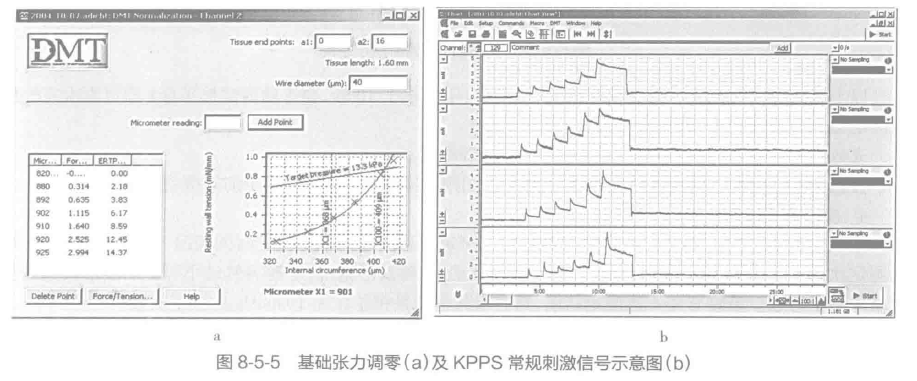 E After 20 minutes of equilibrium, stimulate the blood vessel with KPPS solution for 3 consecutive times, with 10 minutes between each time, and the stimulation signal is shown in Figure 8-5-5a. The stimulation signal is shown in Figure 8-5-5b.
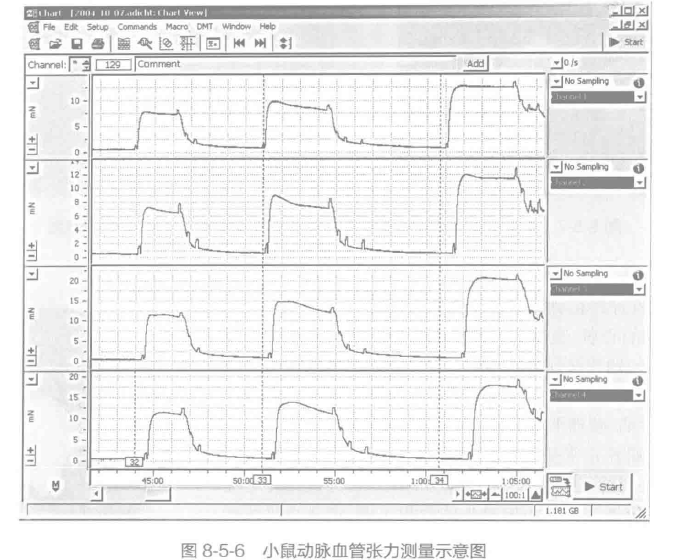
F After 20 minutes of equilibration, the vessels were stimulated with the desired agonist. The results are analyzed in Figure 8-5-6.