Detection of cardiac conduction and arrhythmia in mice experiment
Detection of cardiac conduction and arrhythmia in mice experiment
Electrocardiographic (ECG) studies in mice have been performed for many years and differ from humans by rapid repolarization and by the fusion of the T-wave with the QRS complex in most cases, so that a prolonged Q-T interval is readily identified. Many phenotypes of abnormal cardiac function, such as arrhythmias and sudden cardiac death, have been identified in transgenic mice by ECG. The use of tribromoethanol anesthesia facilitates the detection of ECG in mice, while this compound does not reduce heart rate to any significant extent. On the basis of the abnormal ECG detection, the data of awake mice can be further continuously detected by implanted remote sensing, and arrhythmia mouse models can be artificially obtained by certain stimuli for corresponding drug development.
Operation method
Electrocardiographic analysis of heart rate in mice
Materials and Instruments
Equipment: Move The basic procedure for ECG analysis of heart rate in mice can be divided into the following steps: Caveat The P-wave and QRS wave cluster of mouse ECG are very similar to that of human ECG, but the T-wave, which represents the repolarization phase of the ventricle, is different from that of human. The software is designed to measure human ECG, so we call the wave immediately following the QRS wave group the "T" wave. However, the "T" wave that corresponds to the repolarization phase of the mouse ventricle is actually a J wave. For more product details, please visit Aladdin Scientific website.
Power Lab/4SP with ML135 Dual Bio Amp and MLA0112 ECG Lead Switch Box, needle electrodes, computer, Temperature/Heart Rate Monitoring System for mice as with Doppler testing , heat lamp, masking tape, and gauze.
Reagents:
(1) Inhalational anesthetic isoflurane or tribromoethanol.
A Anesthesia of mice was performed by mask inhalation of oxygen at a flow rate of 700 ml/min, with an induction anesthetic concentration of 5% isoflurane and a maintenance concentration of 1% to 2% isoflurane, or by intraperitoneal injection of tribromoethanol at a working concentration of 0.25%, generally 0.3 to 0.4 ml of anesthetic was used for 30 g of mice, and an excessive anesthesia may lead to an excessive decrease in heart rate. Excessive anesthesia may lead to excessive heart rate drop, which may affect the reliability of the results.
B Rectal temperature was monitored by using a heat sensor and a heat lamp to maintain the rectal temperature of the mice at 37-38 ℃.
C Installation of electrodes The mice were fixed in the supine position, and needle electrodes were inserted into the right forelimb and the two hind limbs of the mice.
D Signal acquisition LabChart 4.2.3 software was used to record the signals for 5-10 minutes.
E After recording of mouse resuscitation, the anesthesia facility, rectal temperature maintenance and monitoring equipment were removed, and the mice were either given 100% pure oxygen or kept warm on a hot plate until they awoke.
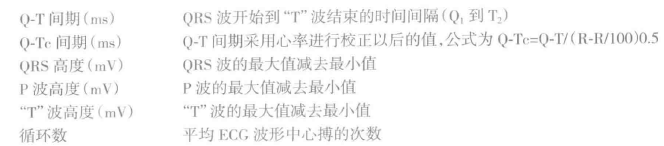
F Data analysis Analyze the stable portion (at least 1-minute signals) of the acquired signals to obtain significant P-wave, QRS-wave, or "T-wave" recordings, as well as temporal-variance phenomena (e.g., irregularity of the duration of intervals). Irregularities). Note ectopic or abnormal beats. A representative 10-15 second recording is averaged to obtain a signal-averaged ECG (SAECG). The SAECG waveform and 1st function are then displayed, and the parameters associated with the SAECG waveform are automatically generated. These parameters include: 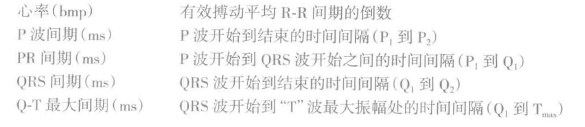
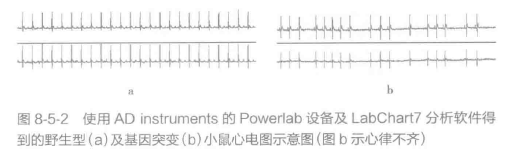
 An example of the result is shown in Figure 8-5-2.