The basic procedure of the hormone level assay can be divided into the following steps, using the mouse serum insulin assay (ELISA) as an example (the specific steps of the assay are performed according to the instructions of the ELISA kit). The procedure for the Linco Rat/Mouse Insulin ELISA kit is as follows:)
A. Dilute the 10x Wash buffer provided in the kit with MilliQ H2O to 1x working solution. For example, 50 ml of 10x Wash buffer should be added to 450 ml of Milli Q H2O.
B. Remove the appropriate number of ELISA strips coated with insulin monoclonal antibody into the plate rack, and place the rest of the ELISA strips into a bag, seal it and store it at 4 ℃. Wash each well of ELISA strips with 300 ul of diluted wash buffer for three times. After washing, pour out the wash buffer and gently tap the wells on a piece of tissue paper to remove any residual liquid in the wells. However, be careful not to dry out the wells completely before proceeding to the next step so as not to affect the experimental results.
C. Arrange the spiking of blanks, standards, QC and samples. If possible, use duplicate wells.
D. Add 10 μl of Assay Buffer and 10 μl of Matrix Solution to the blank control wells; add 10 μl of different concentrations of standard or QC and 10 μl of Matrix Solution to the wells for standard and QC, and the concentrations of standard are: 10 ng/ml, 5 ng/ml, 2 ng/ml, 1 ng/ml, 0.5 ng/ml, 0.5 ng/ml, 0.5 ng/ml, 0.5 ng/ml and 0.5 ng/ml. 0.5 ng/ml, 0.2 ng/ml; add 10 μl of the serum sample for the desired assay and 10 μl of Assay Buffer to the sample wells. add the sample as quickly as possible to prevent the wells from drying out completely.
E. Add 80 μl of Detection Antibody to each reaction well; for best results, this addition should be completed within 1 hour. Seal the ELISA strips in the plate racks with a sealing film, place on a decolorizing shaker, shake gently at an appropriate speed, and incubate for 2 hours at room temperature.
F. Remove the sealing film, pour off the reaction liquid from the wells, and gently tap the wells on a piece of tissue paper to remove any residual liquid.
G. Wash each well 3 times with 300 μl of diluted wash buffer. After washing, pour off the wash buffer and gently tap on a piece of tissue paper to remove any residual liquid in the wells.
H. Add 100 μl of Enzyme Solution to each well, seal the ELISA strips with a sealing film, place on a decolorizing shaker, shake gently at a suitable speed, and incubate for 30 minutes at room temperature.
I. Remove the sealing film, pour off the reaction liquid from the wells, and gently tap the wells on a piece of tissue paper to remove any residual liquid.
J. Wash each well 6 times with 300 μl of diluted wash buffer. After washing, pour off the wash buffer and gently tap on a piece of tissue paper to remove any residual liquid in the wells.
K. Add 100 ul Substrate Solution to each reaction well and seal the ELISA strips with tin foil to protect each reaction well from light. Place on a decolorizing shaker and incubate for approximately 30 minutes at room temperature with gentle shaking at an appropriate speed. Through the reaction with the substrate, the liquid in the reaction wells will turn blue, and the shade of blue is proportional to the amount of insulin. The color change should be observed at all times during this step, as the rate of blue formation will either speed up or slow down depending on the room temperature. Depending on the speed of the blue color change, the incubation time should be precisely controlled and may be less than or more than 30 minutes. The incubation time is judged by the difference in blue color between the blank control wells and the lowest concentration of standard (0.2 ng/ml), and the incubation can be stopped when there is a difference in the shade of blue between the two reaction wells.
L. Add 100 μl Stop Solution to each reaction well and gently tap the plate rack with your hand to mix the liquid well and remove air bubbles. This is where the color in the reaction wells will change from blue to yellow. Then, the light absorption value of each well at 450 nm wavelength was read in 5 minutes with an enzyme meter.
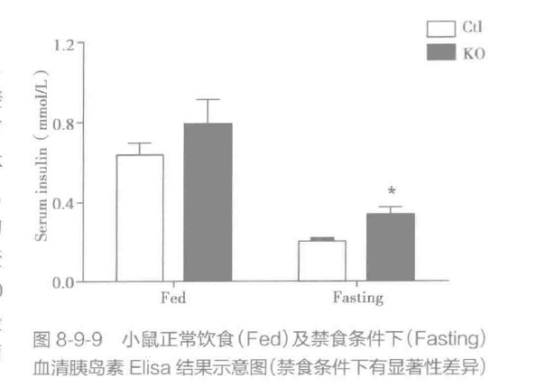
M. Analyze the results of the experiment with Excel software, and take the logarithmic value of the standard curve according to the concentration value of the standard and the light absorption value, and convert the concentration value of the test sample according to the standard curve. Examples of the results are shown in Figure 8-9-9.
Caveat
1. Considering that the concentrations of most hormones in blood and urine are relatively low, their detection needs to be carried out in a specialized laboratory. The detection of hormone levels usually requires a large number of blood samples, so the detection of hormone levels in mice is somewhat difficult, and only 200-300 μl of blood samples can be taken from mice at a time.
2. In general, hormone levels are measured by radioimmunoassay and enzyme-linked immunosorbent assay. It should be emphasized that the collection of blood samples must be fixed at a point in time to avoid fluctuations due to temporal changes in hormone secretion (e.g., the secretion of corticosterone will be higher at 17:00 pm than at 8:00 am in the morning); and the length of the fasting period before the test usually affects the test value of hormone levels, e.g., insulin secretion from the pancreas increases as blood glucose levels increase after meals; and the duration of fasting before the test usually influences the test value. For example, insulin secretion from the pancreas rises as blood glucose levels increase after a meal; and since the secretion of many hormones, such as growth hormone and luteinizing hormone, shows pulsatile changes, repeated samples of these hormones are needed to determine their levels. In short, when testing hormone levels in the body, all factors that may affect the measurement results must be taken into account.
3. In addition to the measurement of static indicators, hormone level testing usually includes the determination of endocrine dynamics, which generally involves changes in the levels of some hormones (insulin) or metabolites (glucose) over time following some metabolic stress. For example, in the measurement of follicle-stimulating hormone and luteinizing hormone, blood samples are measured at 0, 20, and 60 minutes after injection of a dose of luteinizing hormone-releasing hormone. Tests for dynamic markers are also utilized in the detection of body glucose homeostasis, including the high insulin-normal glucose clamp test, oral glucose tolerance test, intraperitoneal glucose tolerance test, and another common dynamic test is the dexamethasone suppression test for the diagnosis of Cushing's Syndrome in humans, where plasma glucocorticoid levels will be measured at various time points after a single dexamethasone dose is injected.
4. The measurement of insulin in the blood can be done with either plasma or serum, and in this chapter we have used serum as the sample to analyze the insulin levels.
For more product details, please visit Aladdin Scientificwebsite.
Was this article helpful?YesNo1 out 1 found this helpful
We use cookies to ensure the website functions properly and, where permitted, to improve your experience. You can manage your preferences at any time in Settings. Learn more in our Cookie Policy.
Shall we send you a message when we have discounts available?
Remind me later
Thank you! Please check your email inbox to confirm.
Products are supplied to verified businesses, institutions, and qualified professionals for research and development use only. Not for use in humans, animals, diagnosis, or therapy.